How accurate is Polymarket? Calibration and Brier scores, by horizon
Public answers to this question range from 94% to 67%, and a Brier score quoted for the platform can be 0.058 or 0.19 depending on who measured it. The figures disagree because they measure different horizons, universes, and metrics, and most published numbers state none of the three. This page publishes the full horizon curve from primary data: every resolved Polymarket market over twelve months, scored at four fixed distances before resolution, with the method stated on every table. Resolutions from July 2025 through June 2026; computed 2026-08-12.
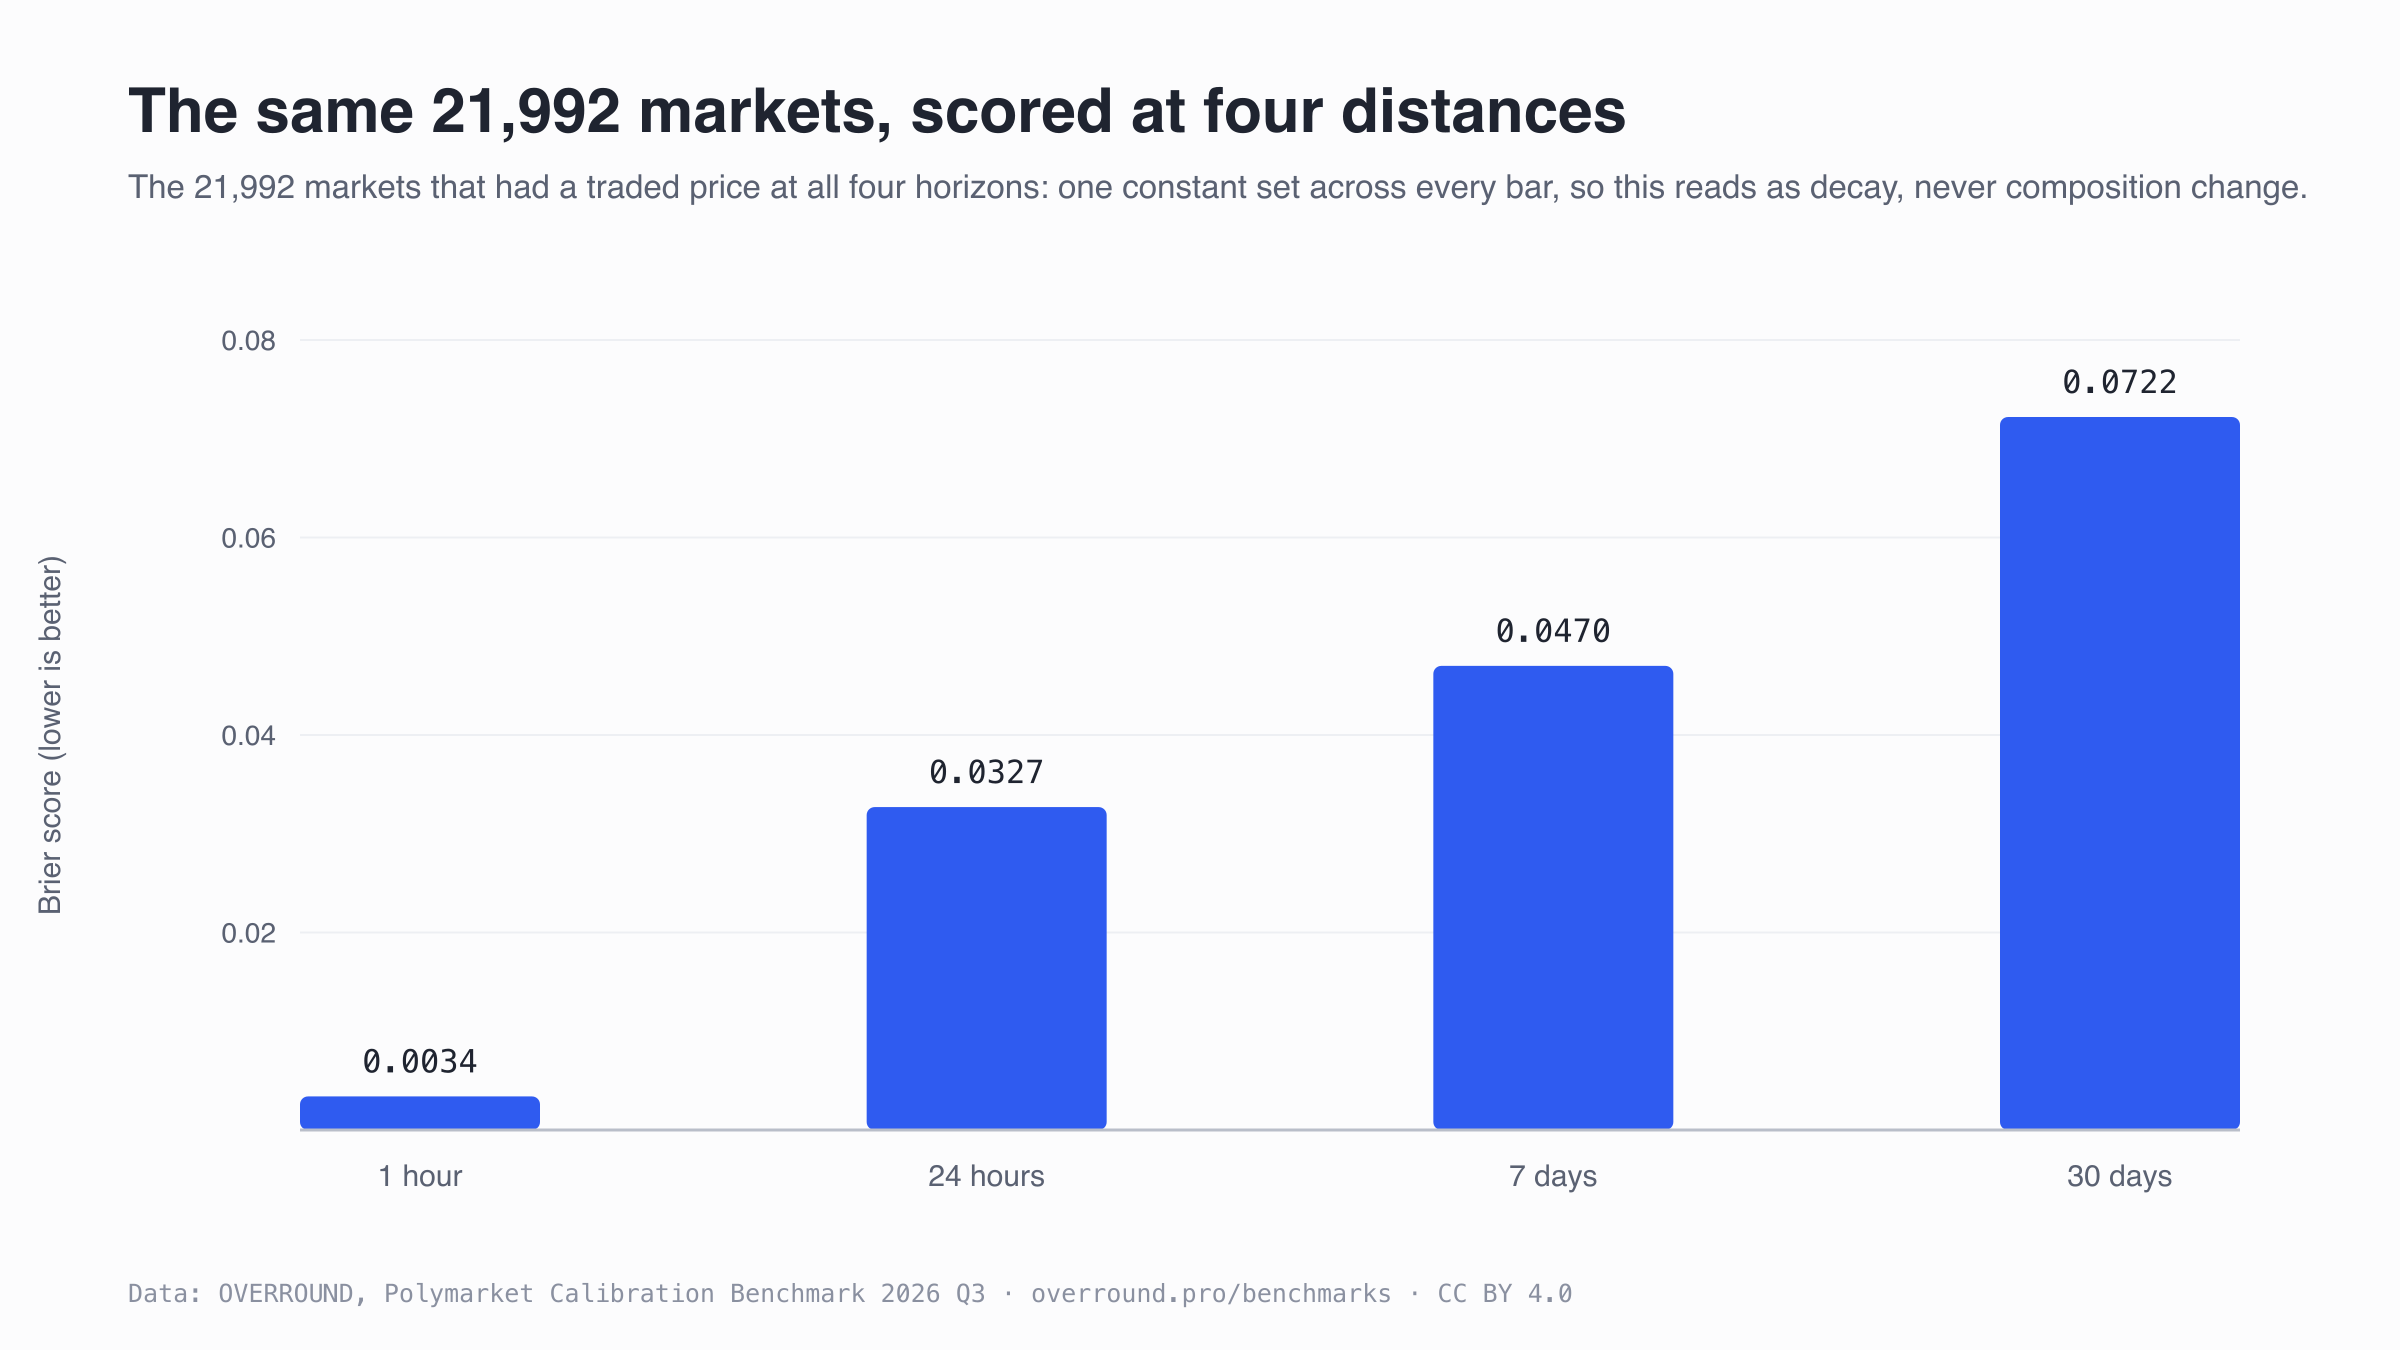
The headline table: the same markets, four distances out
These are the 21,992 markets that had a traded price at every one of the four horizons, so each row scores the same market set and the decay across rows is real. Stated is the average price; resolved is how often the outcome happened; accuracy is the share of markets where the favored side won. A lower Brier score is better; 0.25 is what always guessing 50% scores.
| horizon before resolution | markets | stated (avg) | resolved | Brier score | accuracy |
|---|---|---|---|---|---|
| 1 hour | 21,992 | 15.1% | 14.7% | 0.0034 | 99.6% |
| 24 hours | 21,992 | 14.6% | 14.7% | 0.0327 | 95.7% |
| 7 days | 21,992 | 14.5% | 14.7% | 0.0470 | 93.8% |
| 30 days | 21,992 | 16.4% | 14.7% | 0.0722 | 90.3% |
An hour out, prices are close to settled; a month out, the same markets carry real information and real uncertainty. Any accuracy claim that omits its horizon is choosing its answer.
Each horizon’s full universe
Public dashboards usually quote each horizon over every market that had a price then, so this table is the one to compare against them. Read it one row at a time: the rows are different market sets, because most Polymarket markets live for less than a week and never have a 30-day price at all. Comparing Brier scores across these rows confounds the universe with the horizon, which is one honest reason published figures disagree.
| horizon before resolution | markets | stated (avg) | resolved | Brier score | accuracy |
|---|---|---|---|---|---|
| 1 hour | 676,307 | 37.5% | 36.4% | 0.0155 | 97.9% |
| 24 hours | 259,361 | 28.7% | 28.5% | 0.1253 | 81.2% |
| 7 days | 74,087 | 22.3% | 21.5% | 0.1045 | 85.6% |
| 30 days | 21,992 | 16.4% | 14.7% | 0.0722 | 90.3% |
Calibration curves: stated price vs resolved frequency
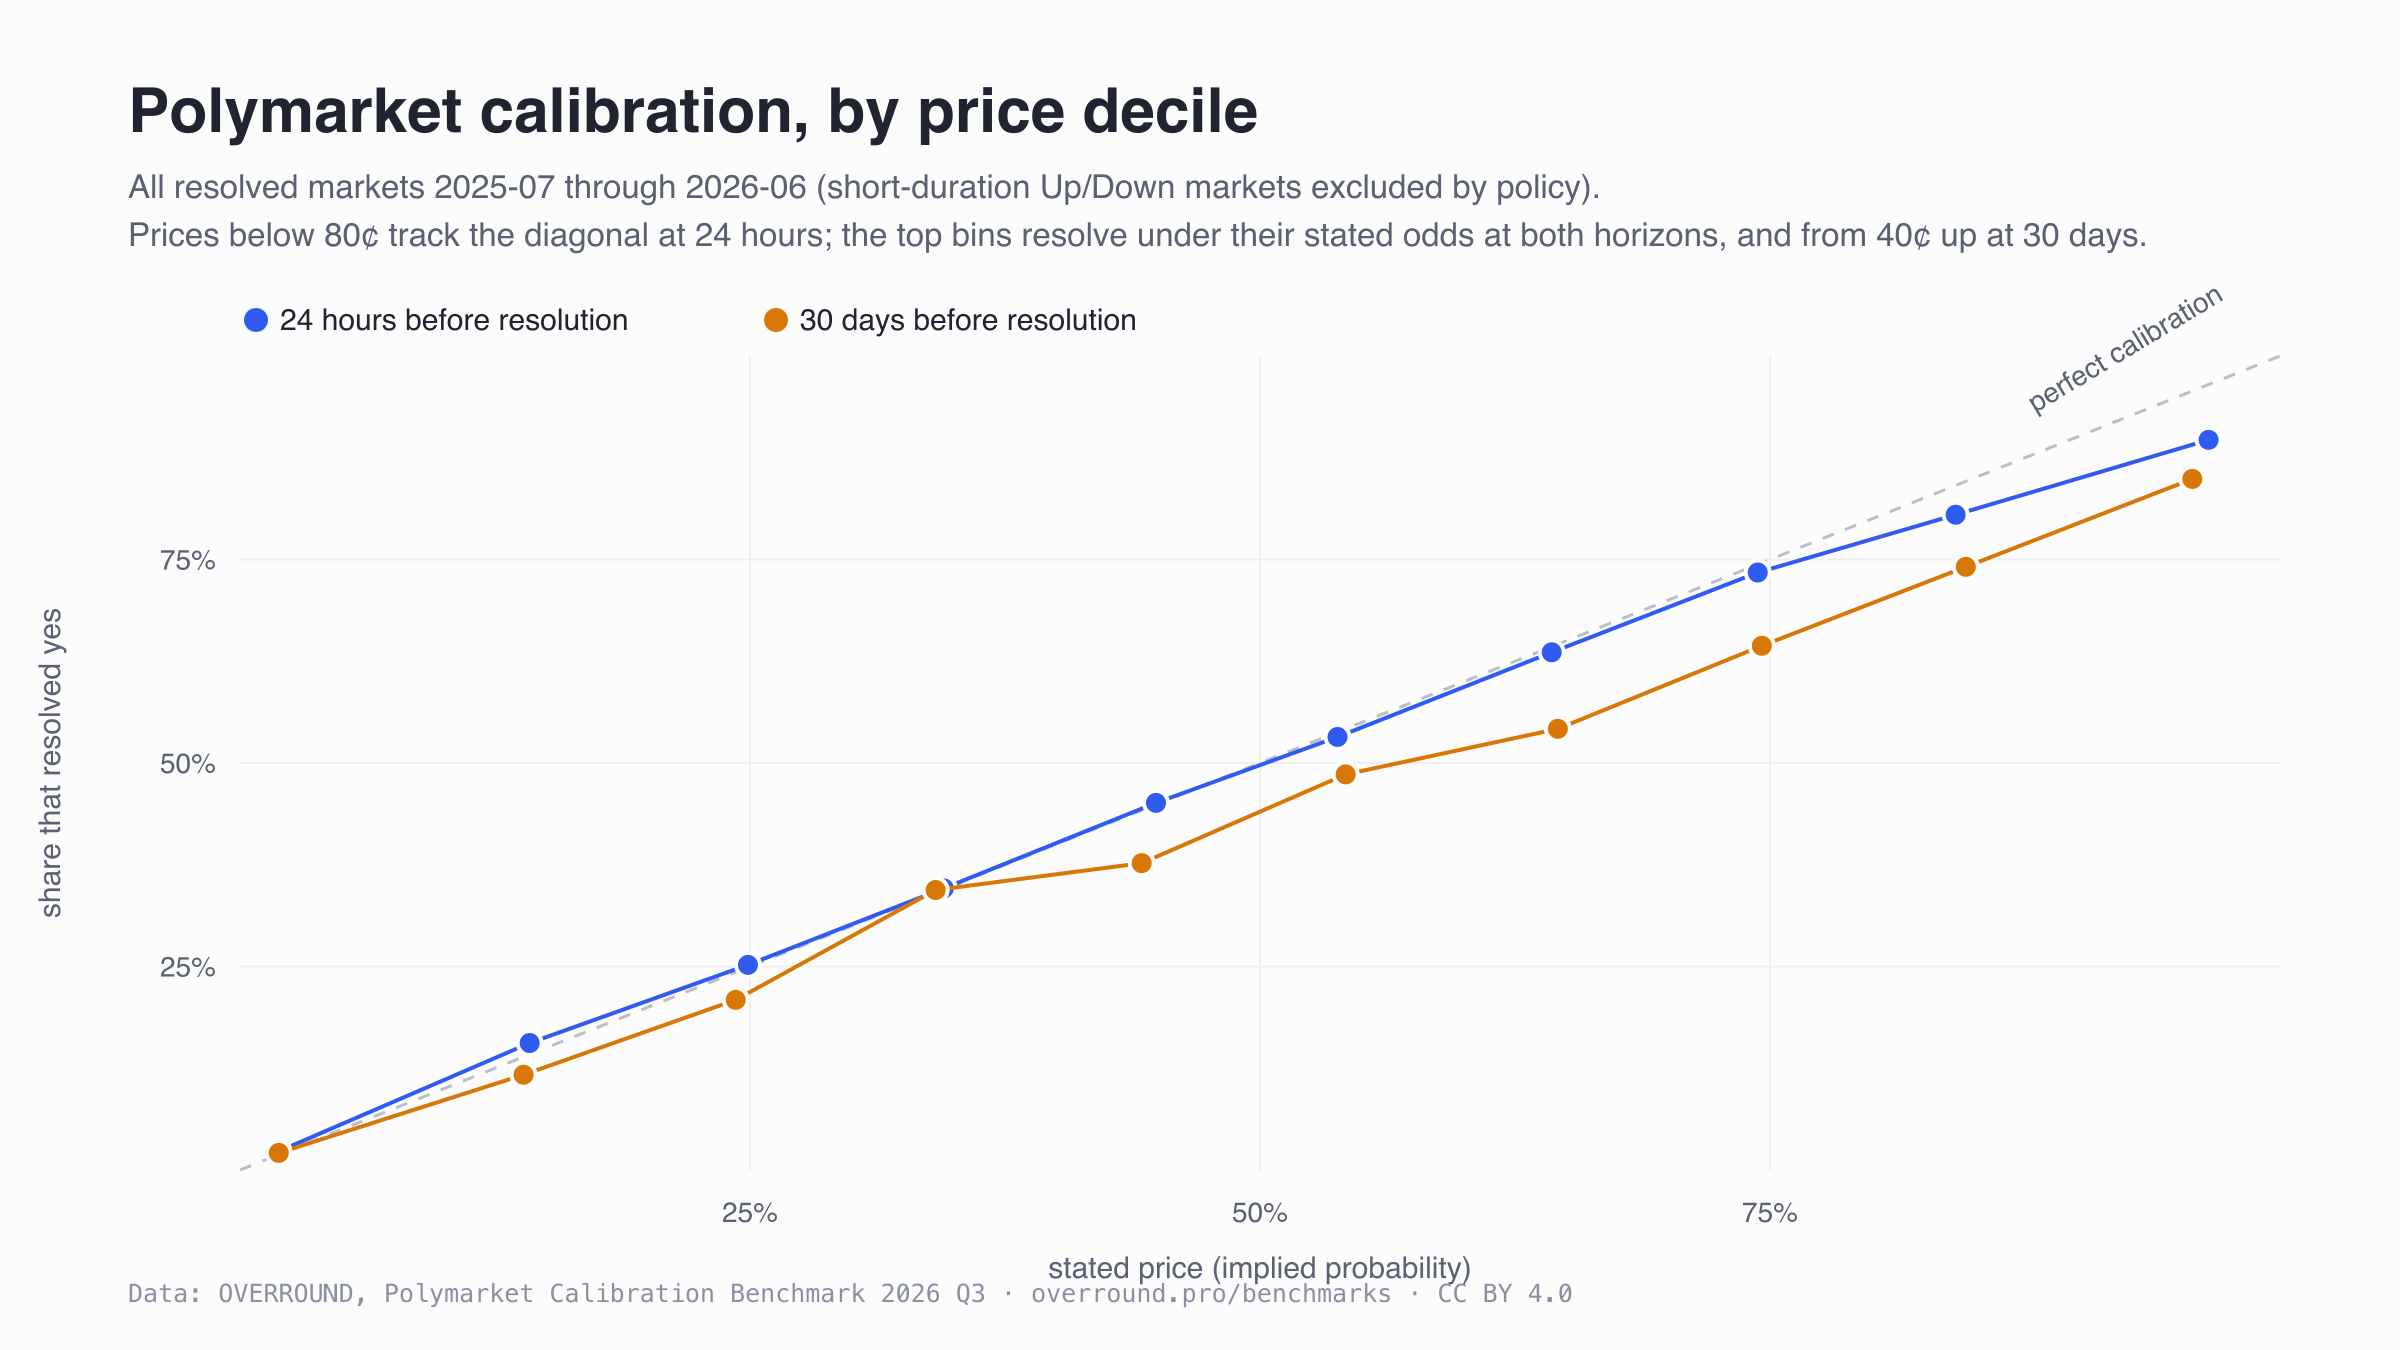
A calibrated market resolves 30-cent outcomes about 30% of the time. The curves at 24 hours and 30 days:
| price bin (24h) | markets | stated (avg) | resolved |
|---|---|---|---|
| 0-10c | 107,240 | 1.9% | 2.3% |
| 10-20c | 19,814 | 14.2% | 15.6% |
| 20-30c | 22,576 | 24.9% | 25.2% |
| 30-40c | 19,656 | 34.5% | 34.6% |
| 40-50c | 24,889 | 44.9% | 45.1% |
| 50-60c | 23,381 | 53.8% | 53.2% |
| 60-70c | 12,019 | 64.3% | 63.6% |
| 70-80c | 9,402 | 74.4% | 73.4% |
| 80-90c | 7,127 | 84.1% | 80.5% |
| 90-100c | 13,257 | 96.5% | 89.7% |
| price bin (30d) | markets | stated (avg) | resolved |
|---|---|---|---|
| 0-10c | 14,688 | 1.9% | 2.1% |
| 10-20c | 1,920 | 13.9% | 11.7% |
| 20-30c | 1,183 | 24.3% | 20.9% |
| 30-40c | 735 | 34.1% | 34.4% |
| 40-50c | 531 | 44.2% | 37.7% |
| 50-60c | 547 | 54.2% | 48.6% |
| 60-70c | 467 | 64.6% | 54.2% |
| 70-80c | 472 | 74.6% | 64.4% |
| 80-90c | 502 | 84.6% | 74.1% |
| 90-100c | 947 | 95.7% | 84.9% |
Two readings worth taking away. At 24 hours the mid-range is calibrated to within about a point: 44.9-cent markets resolve 45.1% of the time. And at 30 days the favorites are systematically overpriced: markets stated at 74.6 cents resolved 64.4% of the time, and the whole upper half of the curve sits below its stated line. A month out, favorite prices ran consistently above their resolved frequencies in this window.
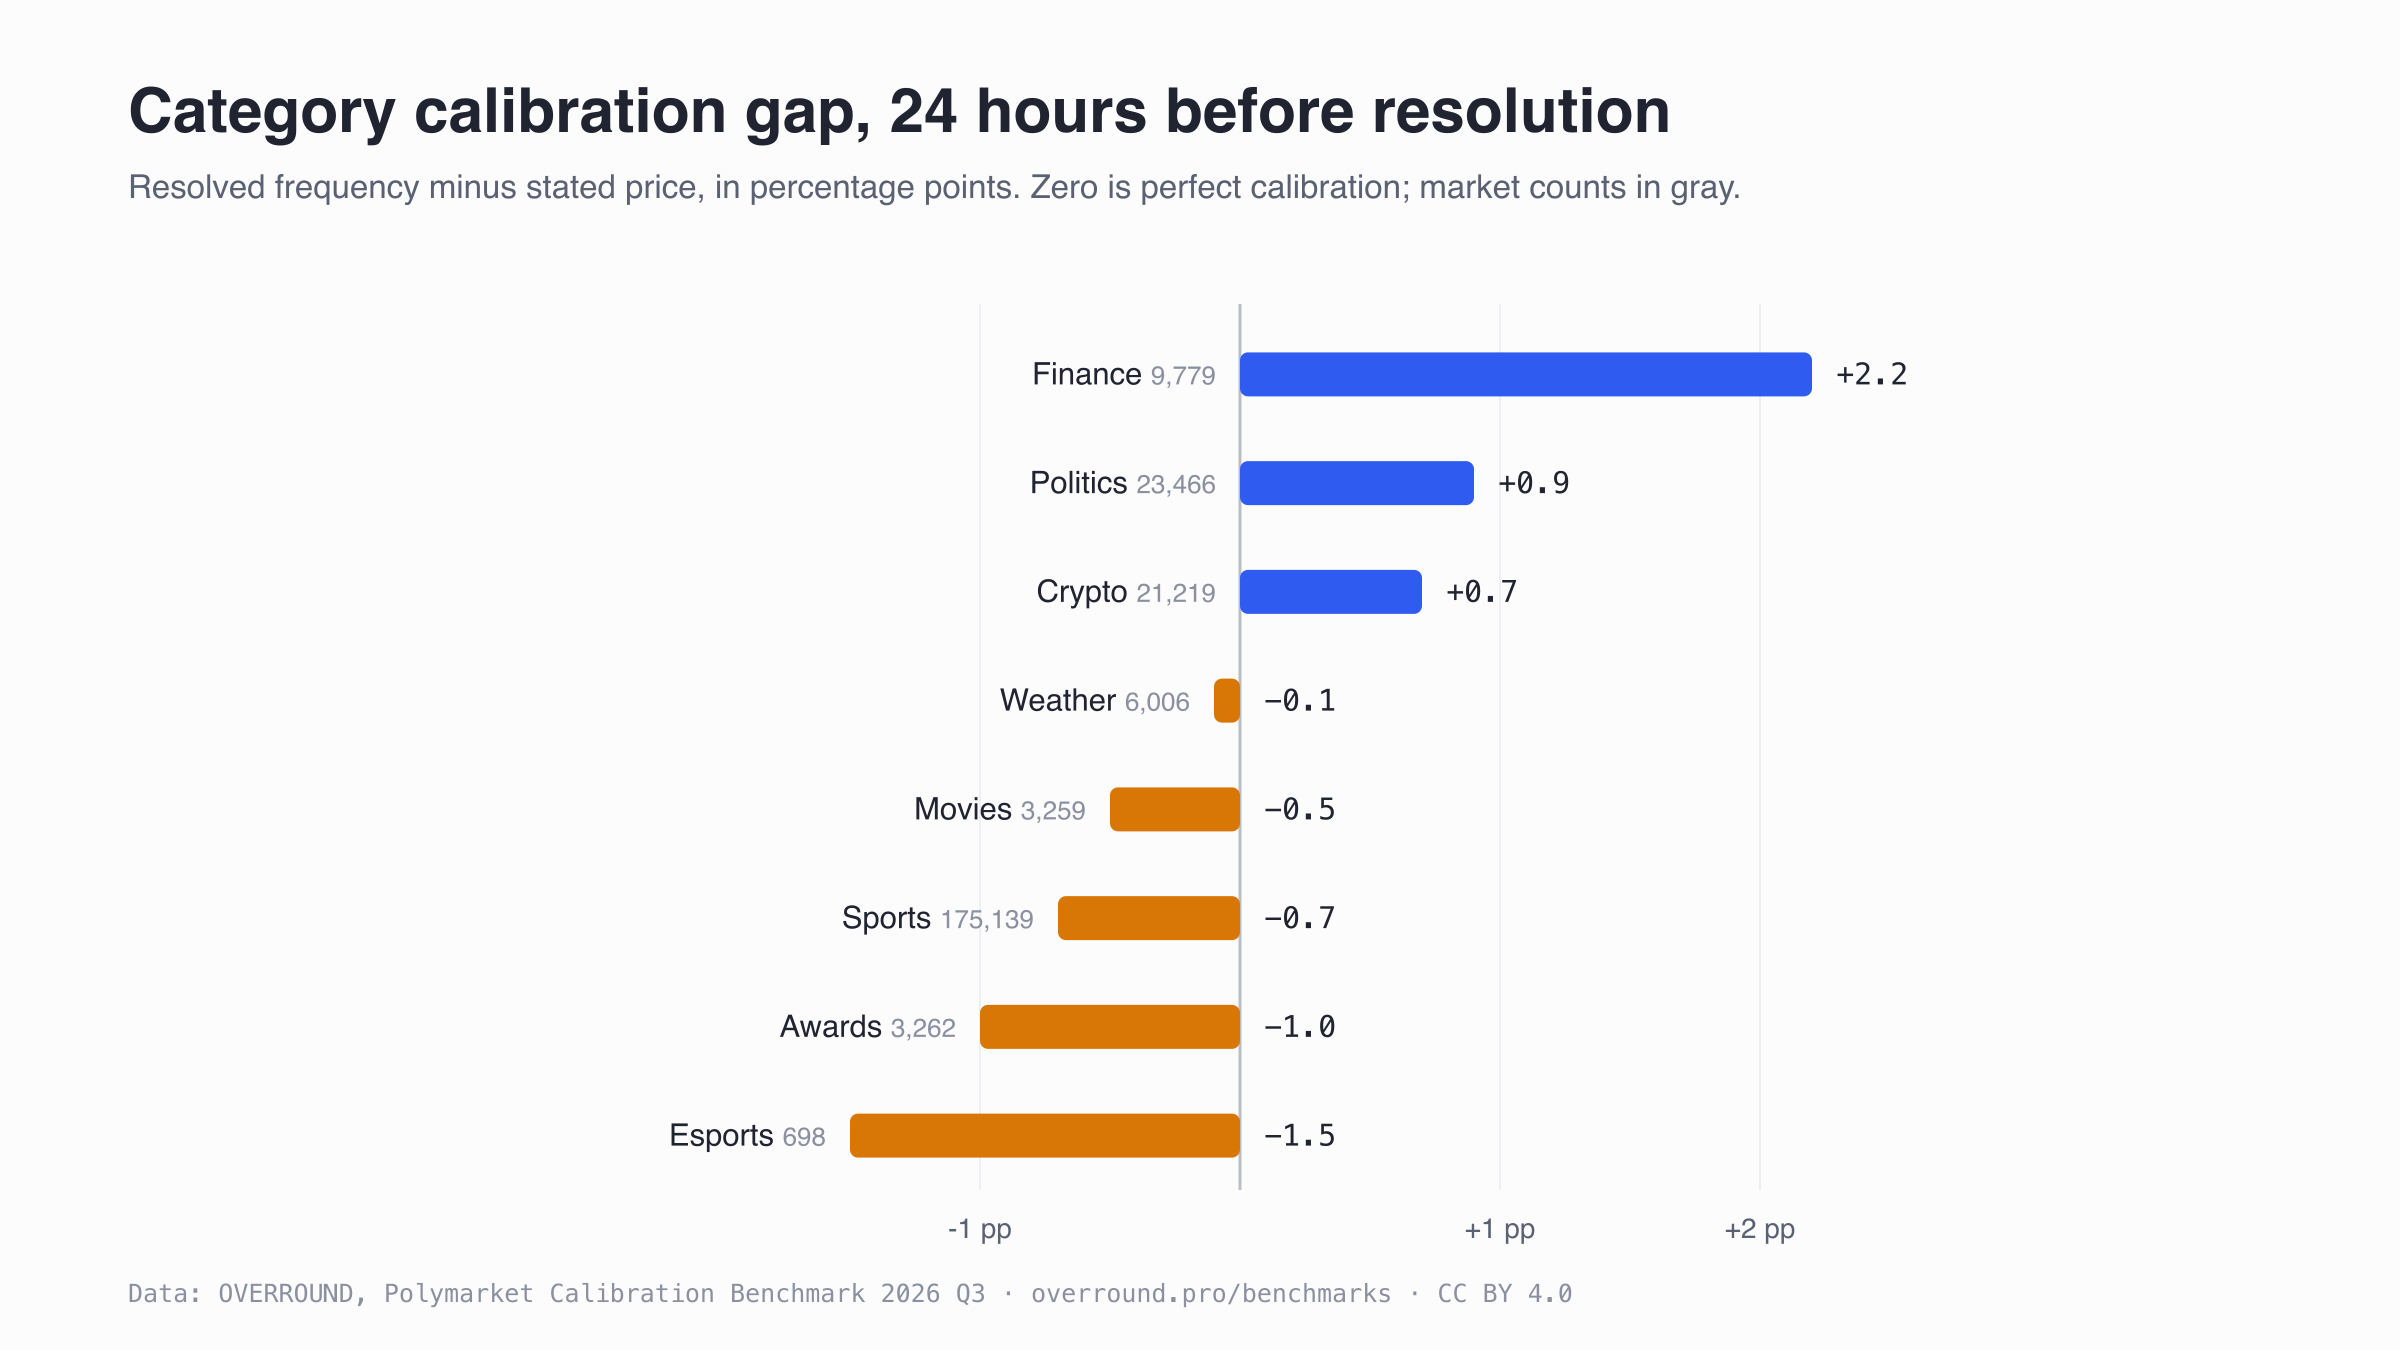
Accuracy by category, 24 hours out
| category | markets | stated (avg) | resolved | Brier | accuracy |
|---|---|---|---|---|---|
| Sports | 175,139 | 33.9% | 33.2% | 0.1565 | 76.2% |
| Politics | 23,466 | 20.4% | 21.3% | 0.0690 | 90.1% |
| Crypto | 21,219 | 11.4% | 12.1% | 0.0523 | 92.7% |
| Finance | 9,779 | 25.7% | 27.9% | 0.0838 | 88.6% |
| Weather | 6,006 | 9.6% | 9.5% | 0.0508 | 93.1% |
| Awards | 3,262 | 17.4% | 16.4% | 0.0693 | 91.1% |
| Movies | 3,259 | 18.3% | 17.8% | 0.0184 | 97.9% |
| Esports | 698 | 40.8% | 39.3% | 0.1391 | 81.1% |
Category Brier scores are not comparable as quality grades without their stated-price columns: a category full of heavy favorites earns a low Brier by construction, and a category trading near 50 cents cannot. The table carries both so readers can make the adjustment.
Why the public figures disagree
- Polymarket’s official ~94%. polymarket.com/accuracy displays figures from data scientist Alex McCullough’s public Dune dashboards: roughly 95% accuracy in the final four hours, and about 90% one month out. Our independent computation lands in the same places: 97.9% at one hour, and 90.3% at thirty days on the full universe. The official figures are real; they are the short-horizon and favorite-heavy end of the curve.
- The Brier score of 0.0581. The same dashboard family reports 0.0581 at 12 hours before resolution and about 0.084 across resolved markets, per third-party summaries. Brier scores quoted without a horizon blend these regimes; our table shows how the score moves from an hour to a month out.
- The 67% political figure. A December 2025 Vanderbilt study (Clinton and Huang) found Polymarket called 67% of political markets better than chance in the 2024 cycle. Different universe (politics only), different metric (better-than-chance calls), different period. Our Politics row above shows the same effect in our data: political markets price closer to 50 cents and score worse than the platform average at every horizon.
- The academic calibration literature. A 2026 study of 292 million trades across Kalshi and Polymarket decomposes calibration into a universal horizon effect, domain effects, and their interaction, and finds political prices chronically compressed toward 50%. Our category table shows domain effects of its own: at 24 hours, Politics, Finance, and Crypto resolved above their stated prices while the other five categories resolved below. The politics curve by price bin (added below, 2026-07-24) complicates the compression story at short horizons: a day out, politics markets under 70 cents resolved above their stated prices and politics favorites resolved below them, which runs opposite to compression at that horizon. Prices read as face-value probabilities mislead unless horizon and domain are stated.
Reuse these charts
Every chart on this page is CC BY 4.0: download, republish, or embed it, including commercially, with attribution. Suggested credit: Data: OVERROUND, Polymarket Calibration Benchmark 2026 Q3, overround.pro/benchmarks (CC BY 4.0). PNGs: calibration curves, horizon decay, category gap. The underlying tables are CSVs on the data downloads page.
Method and boundaries
- Universe: every Polymarket market that resolved between 2025-07-01 and 2026-06-30, excluding voided and disputed markets. One row per market per horizon: the last traded price of the first-listed outcome at that distance before resolution, against the realized outcome.
- What this measures: market prices, and nothing about any trader. Unlike OVERROUND’s wallet grading, correlated markets are NOT collapsed into event families here, so a heavily correlated news cluster counts each market separately. This matches how public accuracy dashboards count and keeps the comparison fair.
- Selection at long horizons: a market with no trade 30 days before resolution, including every market created inside that window, is absent from the 30-day row. Long-horizon rows therefore describe markets that existed and traded early, which skews them toward bigger questions. The constant-universe table removes this confound by scoring only the 21,992 markets priced at all four horizons.
- Coverage: Polymarket’s five-minute Up or Down series are excluded by standing policy. Fill observation for NegRisk V2 contracts had a gap from late April 2026 that was repaired and fully backfilled on 2026-07-20, before this benchmark was computed; the fact-sheet run verifies this empirically on every refresh. Full boundaries on the methodology page.
Robustness cuts, added 2026-07-24
Readers on Reddit asked whether the 30-day favorite gap survives liquidity, staleness, and weighting cuts, and we committed to publishing the answer either way. The answer: they called most of it. The gap concentrates in thin, stale markets, shrinks to 2.4 points in the most liquid tercile, and reverses sign when markets are weighted by dollar volume. All tables below cover the 21,992 markets with a traded price 30 days before resolution; liquidity is dollar volume in the 30 days before that price, and intervals are 95% Wilson.
| liquidity tercile (markets ≥50c) | markets | stated | resolved | gap (pp) | 95% CI |
|---|---|---|---|---|---|
| bottom (under $243) | 828 | 78.6% | 53.1% | -25.4 | 49.7-56.5% |
| middle ($243-$4.5K) | 906 | 77.4% | 72.6% | -4.8 | 69.6-75.4% |
| top (over $4.5K) | 1,201 | 77.4% | 75.0% | -2.4 | 72.5-77.4% |
| last trade behind the 30d price (≥50c) | markets | stated | resolved | gap (pp) | 95% CI |
|---|---|---|---|---|---|
| within 7 days | 2,597 | 77.3% | 68.9% | -8.4 | 67.1-70.7% |
| older than 7 days | 338 | 80.9% | 61.8% | -19.1 | 56.5-66.9% |
| bin (30d) | markets | stated, market-weighted | resolved, market-weighted | stated, volume-weighted | resolved, volume-weighted |
|---|---|---|---|---|---|
| 0-10c | 14,688 | 1.9% | 2.1% | 1.6% | 0.4% |
| 10-20c | 1,920 | 13.9% | 11.7% | 13.9% | 17.4% |
| 20-30c | 1,183 | 24.3% | 20.9% | 24.0% | 19.9% |
| 30-40c | 735 | 34.1% | 34.4% | 33.3% | 39.1% |
| 40-50c | 531 | 44.2% | 37.7% | 44.7% | 63.1% |
| 50-60c | 547 | 54.2% | 48.6% | 55.6% | 52.9% |
| 60-70c | 467 | 64.6% | 54.2% | 67.1% | 69.5% |
| 70-80c | 472 | 74.6% | 64.4% | 73.6% | 89.6% |
| 80-90c | 502 | 84.6% | 74.1% | 85.1% | 93.1% |
| 90-100c | 947 | 95.7% | 84.9% | 95.9% | 99.4% |
Volume weights are dominated by the largest markets, so the volume-weighted columns say where the dollars traded rather than what a typical market did. Read together: counted per market, month-out favorites sagged; weighted by money, they did not.
| category (30d, ≥50c) | markets | stated | resolved | gap (pp) | 95% CI |
|---|---|---|---|---|---|
| Sports | 919 | 78.4% | 66.5% | -11.9 | 63.4-69.5% |
| Politics | 787 | 77.6% | 70.8% | -6.8 | 67.5-73.8% |
| Crypto | 206 | 78.5% | 67.5% | -11.0 | 60.8-73.5% |
| Awards | 178 | 77.2% | 71.9% | -5.3 | 64.9-78.0% |
| Finance | 150 | 77.3% | 41.3% | -36.0 | 33.8-49.3% |
The gap appears within every category with at least 100 qualifying markets, so category mix alone does not explain it. Finance is the extreme case and the clearest illustration of the mechanism: month-long hit-a-level markets routinely carry high prices on a few dollars of monthly volume, so their 30-day snapshots are stale quotes rather than live opinions.
| category | liquidity tercile | markets | stated | resolved | gap (pp) | 95% CI |
|---|---|---|---|---|---|---|
| Sports | 1 (thin) | 411 | 80.5% | 57.7% | -22.9 | 52.8-62.3% |
| Sports | 2 | 296 | 77.2% | 75.0% | -2.2 | 69.8-79.6% |
| Sports | 3 (liquid) | 212 | 76.0% | 71.7% | -4.3 | 65.3-77.3% |
| Politics | 1 (thin) | 141 | 75.9% | 50.4% | -25.5 | 42.2-58.5% |
| Politics | 2 | 263 | 78.9% | 70.7% | -8.2 | 65.0-75.9% |
| Politics | 3 (liquid) | 383 | 77.3% | 78.3% | +1.0 | 73.9-82.2% |
| Crypto | 1 (thin) | 37 * | 81.5% | 56.8% | -24.8 | 40.9-71.3% |
| Crypto | 2 | 61 | 79.3% | 77.0% | -2.2 | 65.1-85.8% |
| Crypto | 3 (liquid) | 108 | 77.0% | 65.7% | -11.3 | 56.4-74.0% |
| Awards | 1 (thin) | 45 * | 76.0% | 53.3% | -22.7 | 39.1-67.1% |
| Awards | 2 | 51 | 79.1% | 86.3% | +7.2 | 74.3-93.2% |
| Awards | 3 (liquid) | 82 | 76.8% | 73.2% | -3.6 | 62.7-81.6% |
| Finance | 1 (thin) | 80 | 78.5% | 32.5% | -46.0 | 23.2-43.4% |
| Finance | 2 | 29 * | 73.9% | 44.8% | -29.0 | 28.4-62.5% |
| Finance | 3 (liquid) | 41 * | 77.4% | 56.1% | -21.3 | 41.0-70.1% |
The cross-tab (cells marked * hold fewer than 50 markets and are indicative only) shows the liquidity gradient inside each category: every category’s thin tercile sags 20 points or more, while liquid politics favorites resolved a point above their prices. Finance sags at every liquidity level, the one genuine category effect the cuts leave standing.
| Politics, 24h, by decile | markets | stated | resolved | 95% CI |
|---|---|---|---|---|
| 0-10c | 15,184 | 1.1% | 1.2% | 1.1-1.4% |
| 10-20c | 1,212 | 14.1% | 19.3% | 17.2-21.6% |
| 20-30c | 885 | 24.3% | 28.8% | 25.9-31.9% |
| 30-40c | 863 | 34.7% | 41.0% | 37.8-44.3% |
| 40-50c | 781 | 44.3% | 48.9% | 45.4-52.4% |
| 50-60c | 780 | 54.3% | 55.8% | 52.3-59.2% |
| 60-70c | 709 | 64.7% | 68.0% | 64.5-71.3% |
| 70-80c | 711 | 74.4% | 72.7% | 69.3-75.9% |
| 80-90c | 661 | 84.5% | 80.9% | 77.8-83.8% |
| 90-100c | 1,680 | 97.0% | 95.7% | 94.6-96.5% |
A day out, politics outcomes under 70 cents happened more often than their prices claimed (14-cent markets resolved 19.3% of the time) while politics favorites resolved below theirs. At this horizon politics prices ran more extreme than outcomes, the opposite of the long-horizon compression reported in the academic literature.
Six-hour band cut, added 2026-08-12
An external pre-registered study of prediction-market calibration, run on another venue, fixes its band edges in advance: longshot below 15 cents, favorite above 85, middle between, measured six hours before resolution. We produced the same cut from this benchmark’s pipeline as a stated prior, recorded here and in the archived deposit before any of that study’s data exists. The six-hour horizon inherits the deposited universe, anchors, and outcomes unchanged. Of the 676,307 markets priced an hour out, 435,582 have a traded price six hours out (stated average 33.8%, resolved 33.5%, Brier 0.1311). Bands are taken on the six-hour price; boundary prices fall in the middle band; gap is resolved frequency minus stated price. Gaps are computed on unrounded values, so a printed gap can differ from the displayed subtraction by 0.1 pp.
| population | band (6h price) | markets | stated | resolved | gap (pp) | 95% CI |
|---|---|---|---|---|---|---|
| all categories | longshot (<15c) | 169,435 | 2.6% | 2.8% | +0.3 | 2.8-2.9% |
| all categories | middle (15-85c) | 227,222 | 46.3% | 46.0% | -0.4 | 45.8-46.2% |
| all categories | favorite (>85c) | 38,925 | 96.8% | 93.6% | -3.2 | 93.4-93.8% |
| Politics | longshot (<15c) | 17,689 | 1.0% | 1.2% | +0.1 | 1.0-1.3% |
| Politics | middle (15-85c) | 4,917 | 50.3% | 57.1% | +6.8 | 55.7-58.4% |
| Politics | favorite (>85c) | 2,908 | 96.7% | 96.4% | -0.2 | 95.7-97.0% |
| Weather | longshot (<15c) | 5,267 | 0.7% | 0.6% | -0.1 | 0.4-0.9% |
| Weather | middle (15-85c) | 361 | 36.1% | 22.2% | -13.9 | 18.2-26.7% |
| Weather | favorite (>85c) | 470 | 98.4% | 97.4% | -1.0 | 95.6-98.5% |
Six hours out, longshots and the middle band price close to their outcome rates, and favorites resolve 3.2 points under their stated odds. Politics middles resolved 6.8 points above their prices, the same direction the 24-hour politics deciles show above. The weather middle band holds 361 markets, the smallest cell here; its interval is wide; treat it as indicative.
| band | liquidity tercile | markets | stated | resolved | gap (pp) | 95% CI |
|---|---|---|---|---|---|---|
| longshot (<15c) | 1 (thin) | 56,479 | 3.6% | 4.5% | +0.9 | 4.3-4.7% |
| longshot (<15c) | 2 | 56,478 | 2.4% | 2.3% | 0.0 | 2.2-2.5% |
| longshot (<15c) | 3 (liquid) | 56,478 | 1.8% | 1.7% | -0.1 | 1.6-1.8% |
| middle (15-85c) | 1 (thin) | 75,741 | 46.1% | 45.2% | -0.9 | 44.9-45.6% |
| middle (15-85c) | 2 | 75,741 | 45.7% | 45.4% | -0.3 | 45.0-45.7% |
| middle (15-85c) | 3 (liquid) | 75,740 | 47.3% | 47.4% | +0.1 | 47.0-47.8% |
| favorite (>85c) | 1 (thin) | 12,975 | 96.8% | 89.4% | -7.4 | 88.9-89.9% |
| favorite (>85c) | 2 | 12,975 | 96.9% | 95.1% | -1.8 | 94.7-95.4% |
| favorite (>85c) | 3 (liquid) | 12,975 | 96.7% | 96.3% | -0.3 | 96.0-96.6% |
| band | markets | stated, market-weighted | resolved, market-weighted | stated, volume-weighted | resolved, volume-weighted |
|---|---|---|---|---|---|
| longshot (<15c) | 169,435 | 2.6% | 2.8% | 1.1% | 0.8% |
| middle (15-85c) | 227,222 | 46.3% | 46.0% | 48.4% | 50.1% |
| favorite (>85c) | 38,925 | 96.8% | 93.6% | 98.4% | 98.9% |
The robustness structure repeats the 30-day findings at this horizon. The favorite gap sits in the thin tercile (-7.4 points) and nearly disappears in the liquid tercile (-0.3); weighted by dollar volume it flips sign. Liquidity is dollar volume in the 30 days before the six-hour cutoff, so tercile assignment uses no information after the price being tested. Two method notes for anyone reusing this cut: prices are the last traded price of the first-listed outcome at or before the cutoff, and where several fills share the final second we take that sweep’s first fill (the horizons deposited in July left this tie to physical ordering; the two rules agree on nearly every sampled market). The four CSVs behind this section are archived in version 2 of the Zenodo deposit.
Citing this page
- Cite as OVERROUND (overround.pro), Polymarket calibration benchmark, 2026 Q3. The date pins the snapshot; the next edition ships next quarter.
- For academic citation, this edition has a DOI: 10.5281/zenodo.21790936. It resolves to a Zenodo archive of the same CSVs and charts, deposited as a fixed edition, so the citation keeps working independently of this site. The 2026-08-12 six-hour band tables are archived as version 2 of the same record, listed on that DOI’s version history; the July tables are unchanged.
- License: CC BY 4.0. Reuse these tables freely with attribution. The core tables on this page are downloadable as CSV from the data page; the robustness-cut tables are published on this page only.
- Related: every edition of this benchmark on the benchmarks page, aggregate top-wallet calibration on the statistics page, wallet-level grading on the free checker, and the scoring method on the methodology page.
- Questions or data requests: hello@overround.pro.
Computed from public on-chain data by the same pipeline that serves the product, cross-checked before publication (including resolved-outcome spot checks against Polymarket’s public API). Nothing here is financial or investment advice. Past accuracy does not predict future outcomes.
The Weekly Skill Report. Leaderboard changes, notable wallet moves, and every newly graded alert from the featured feed, the alerts subscribers receive. Wins and losses both, one email each Monday.
Free. Unsubscribe anytime. Privacy.