How accurate is Polymarket? Calibration and Brier scores by horizon, 2026 Q4
This edition scores every resolved Polymarket market from October 2025 through September 2026 at four fixed distances before resolution, 1 hour, 24 hours, 7 days and 30 days, with the method stated on every table. The Q3 edition covered July 2025 through June 2026. The nine months the two share were scored again from scratch for this edition, and every market scored in both has the same outcome. Editions are named for the quarter they are published in. Computed 2026-10-09.
The headline table: the same markets, four distances out
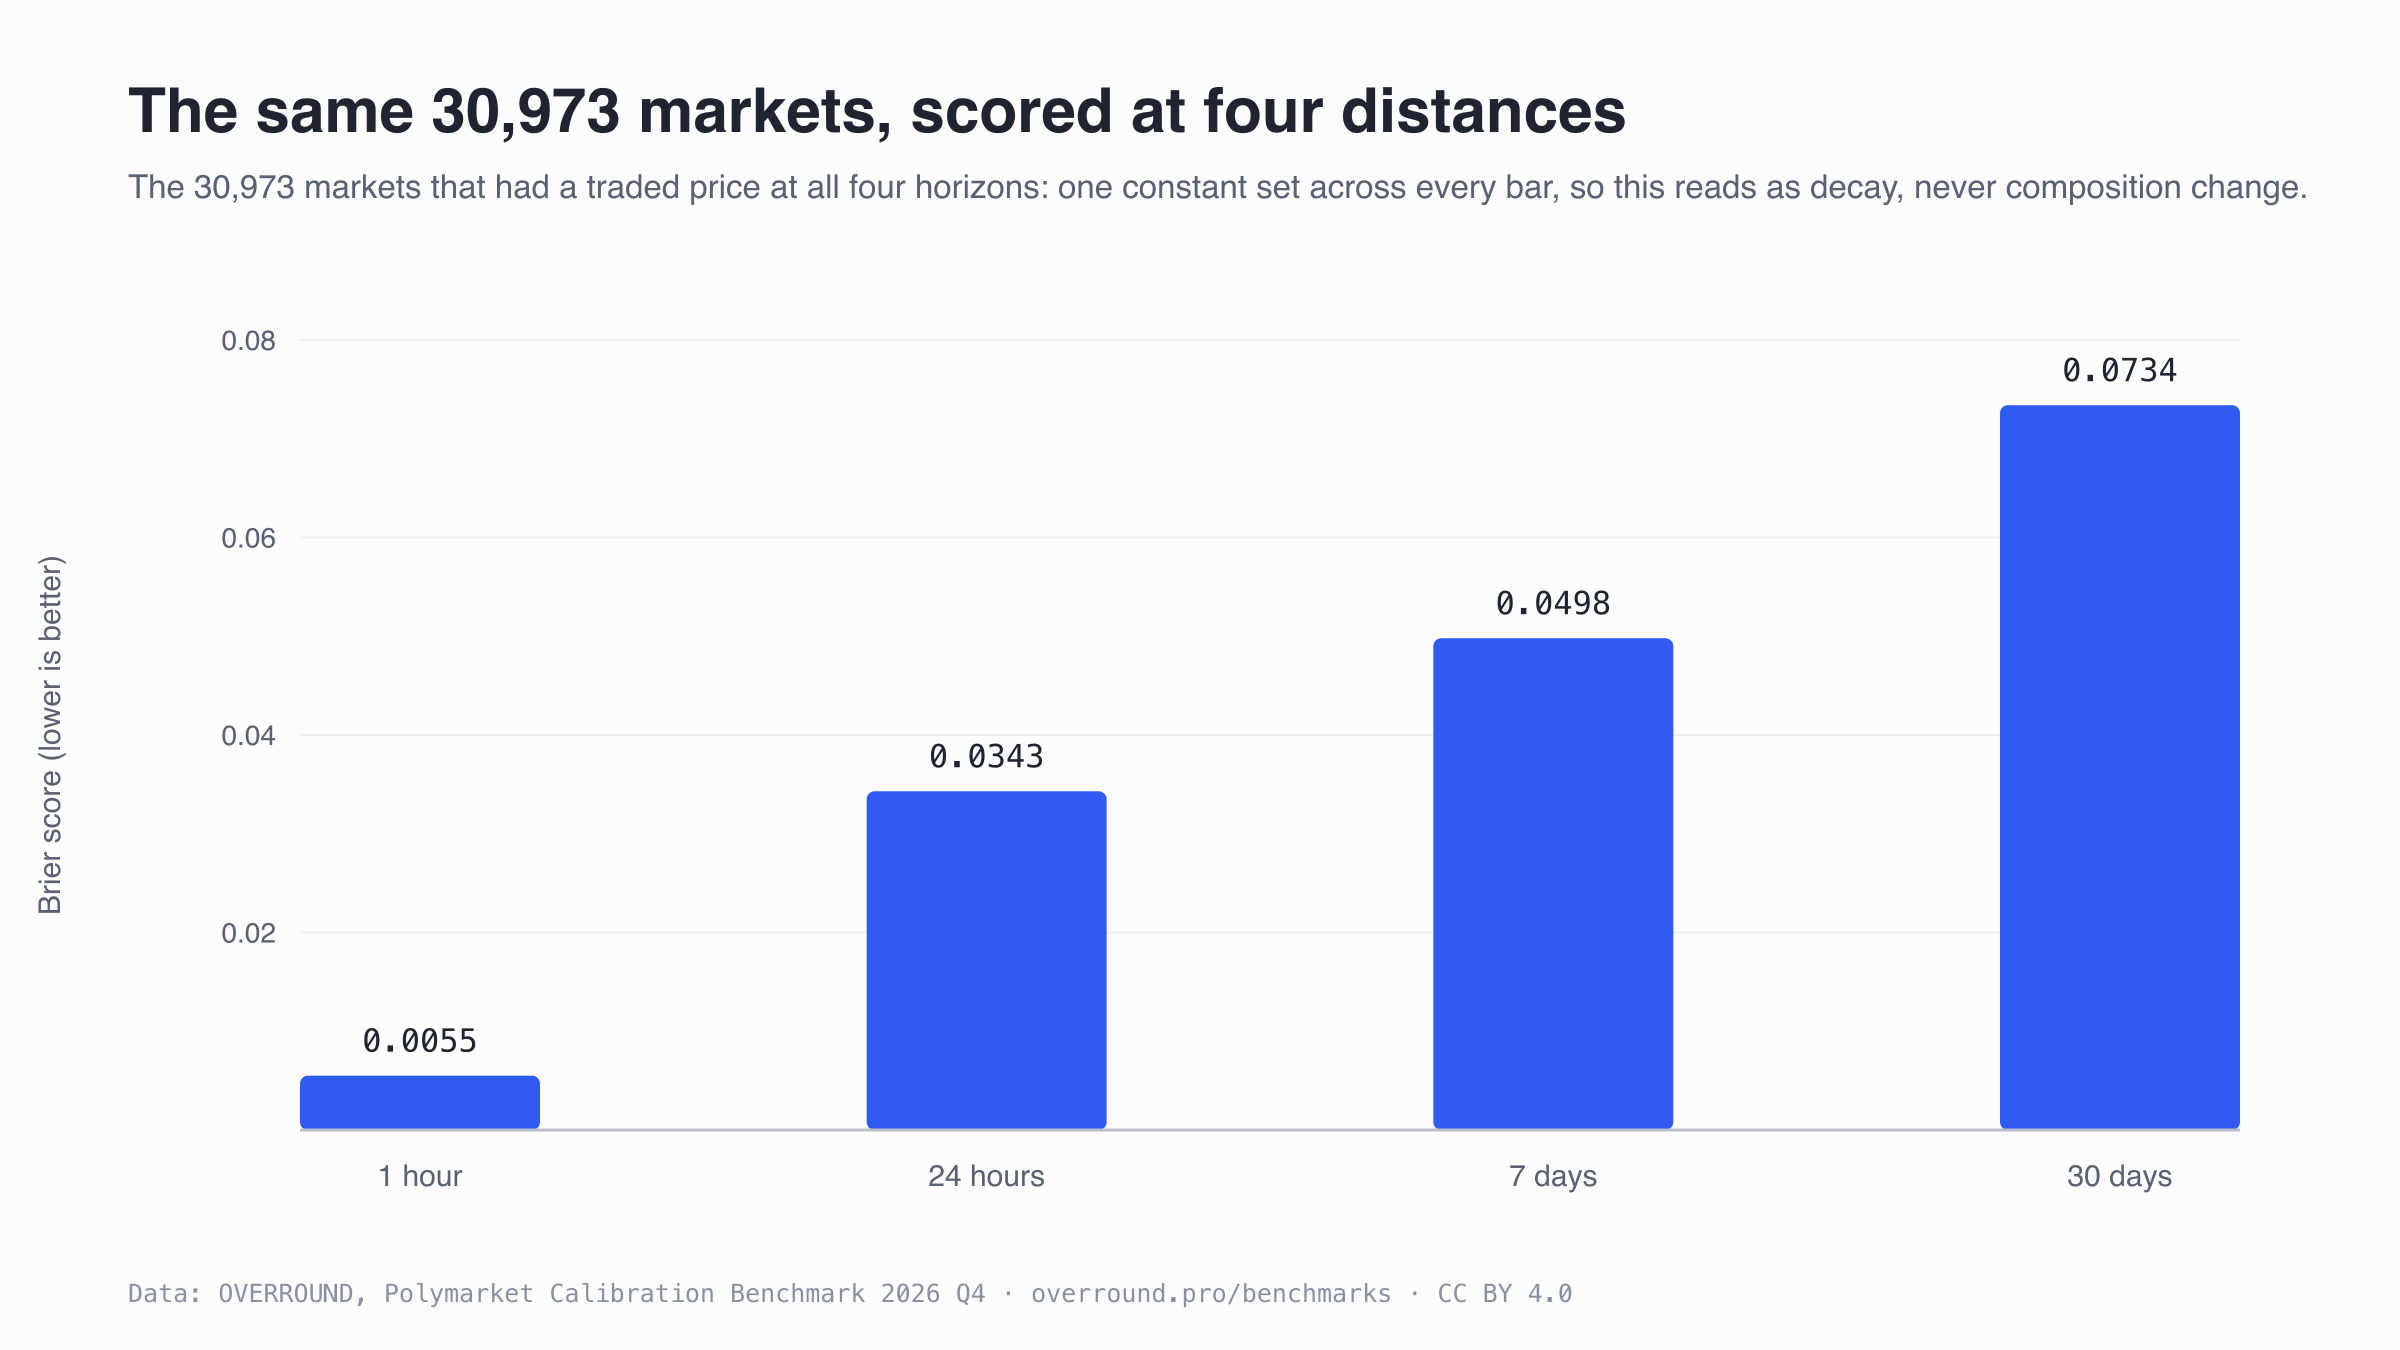
These are the 30,973 markets that had a traded price at every one of the four horizons, so each row scores the same market set and the change across rows comes from the horizon alone. Stated is the average price; resolved is how often the outcome happened; accuracy is the share of markets where the favored side won. A lower Brier score is better; 0.25 is what always guessing 50% scores.
| horizon before resolution | markets | stated (avg) | resolved | Brier score | accuracy |
|---|---|---|---|---|---|
| 1 hour | 30,973 | 14.8% | 14.4% | 0.0055 | 99.3% |
| 24 hours | 30,973 | 14.4% | 14.4% | 0.0343 | 95.5% |
| 7 days | 30,973 | 14.4% | 14.4% | 0.0498 | 93.4% |
| 30 days | 30,973 | 16.2% | 14.4% | 0.0734 | 90.2% |
An hour before resolution these markets scored 0.0055 and the favorite won 99.3% of the time. A month out the same markets scored 0.0734 and 90.2%.
The wallets behind these prices, graded against what they paid
This page scores Polymarket’s prices. The skill leaderboard scores the wallets trading these markets, against the prices they paid, and each category’s #1 forecaster is free to read, with its score, calibration diagram and graded history in the category it leads.
See each category’s #1 forecaster →Every position the product has ever alerted is graded in public on the receipts ledger, losses included. To grade one wallet yourself, paste it into the free checker.
Each horizon’s full universe
Public dashboards usually quote each horizon over every market that had a price then, so this table is the one to compare against them. Read it one row at a time. The rows are different market sets, because most Polymarket markets live for less than a week and never have a 30-day price at all, so comparing Brier scores across these rows mixes up the market set with the horizon.
| horizon before resolution | markets | stated (avg) | resolved | Brier score | accuracy |
|---|---|---|---|---|---|
| 1 hour | 1,270,608 | 35.8% | 34.7% | 0.0349 | 95.1% |
| 24 hours | 434,075 | 27.8% | 27.6% | 0.1211 | 82.0% |
| 7 days | 98,662 | 22.0% | 21.3% | 0.1002 | 86.2% |
| 30 days | 30,973 | 16.2% | 14.4% | 0.0734 | 90.2% |
The 1-hour row in this edition reads 95.1%, against 97.9% in the Q3 edition. In July to September 2026, which holds 48.9% of this edition’s 1-hour rows, 24.8% of game-market prices at the 1-hour mark were pre-game, and those favorites won 82.1% of the time; favorites priced after the start won 94.7%, below the 97.8% to 99.7% of earlier quarters. The price-age section below has the tables.
Calibration curves: stated price vs resolved frequency
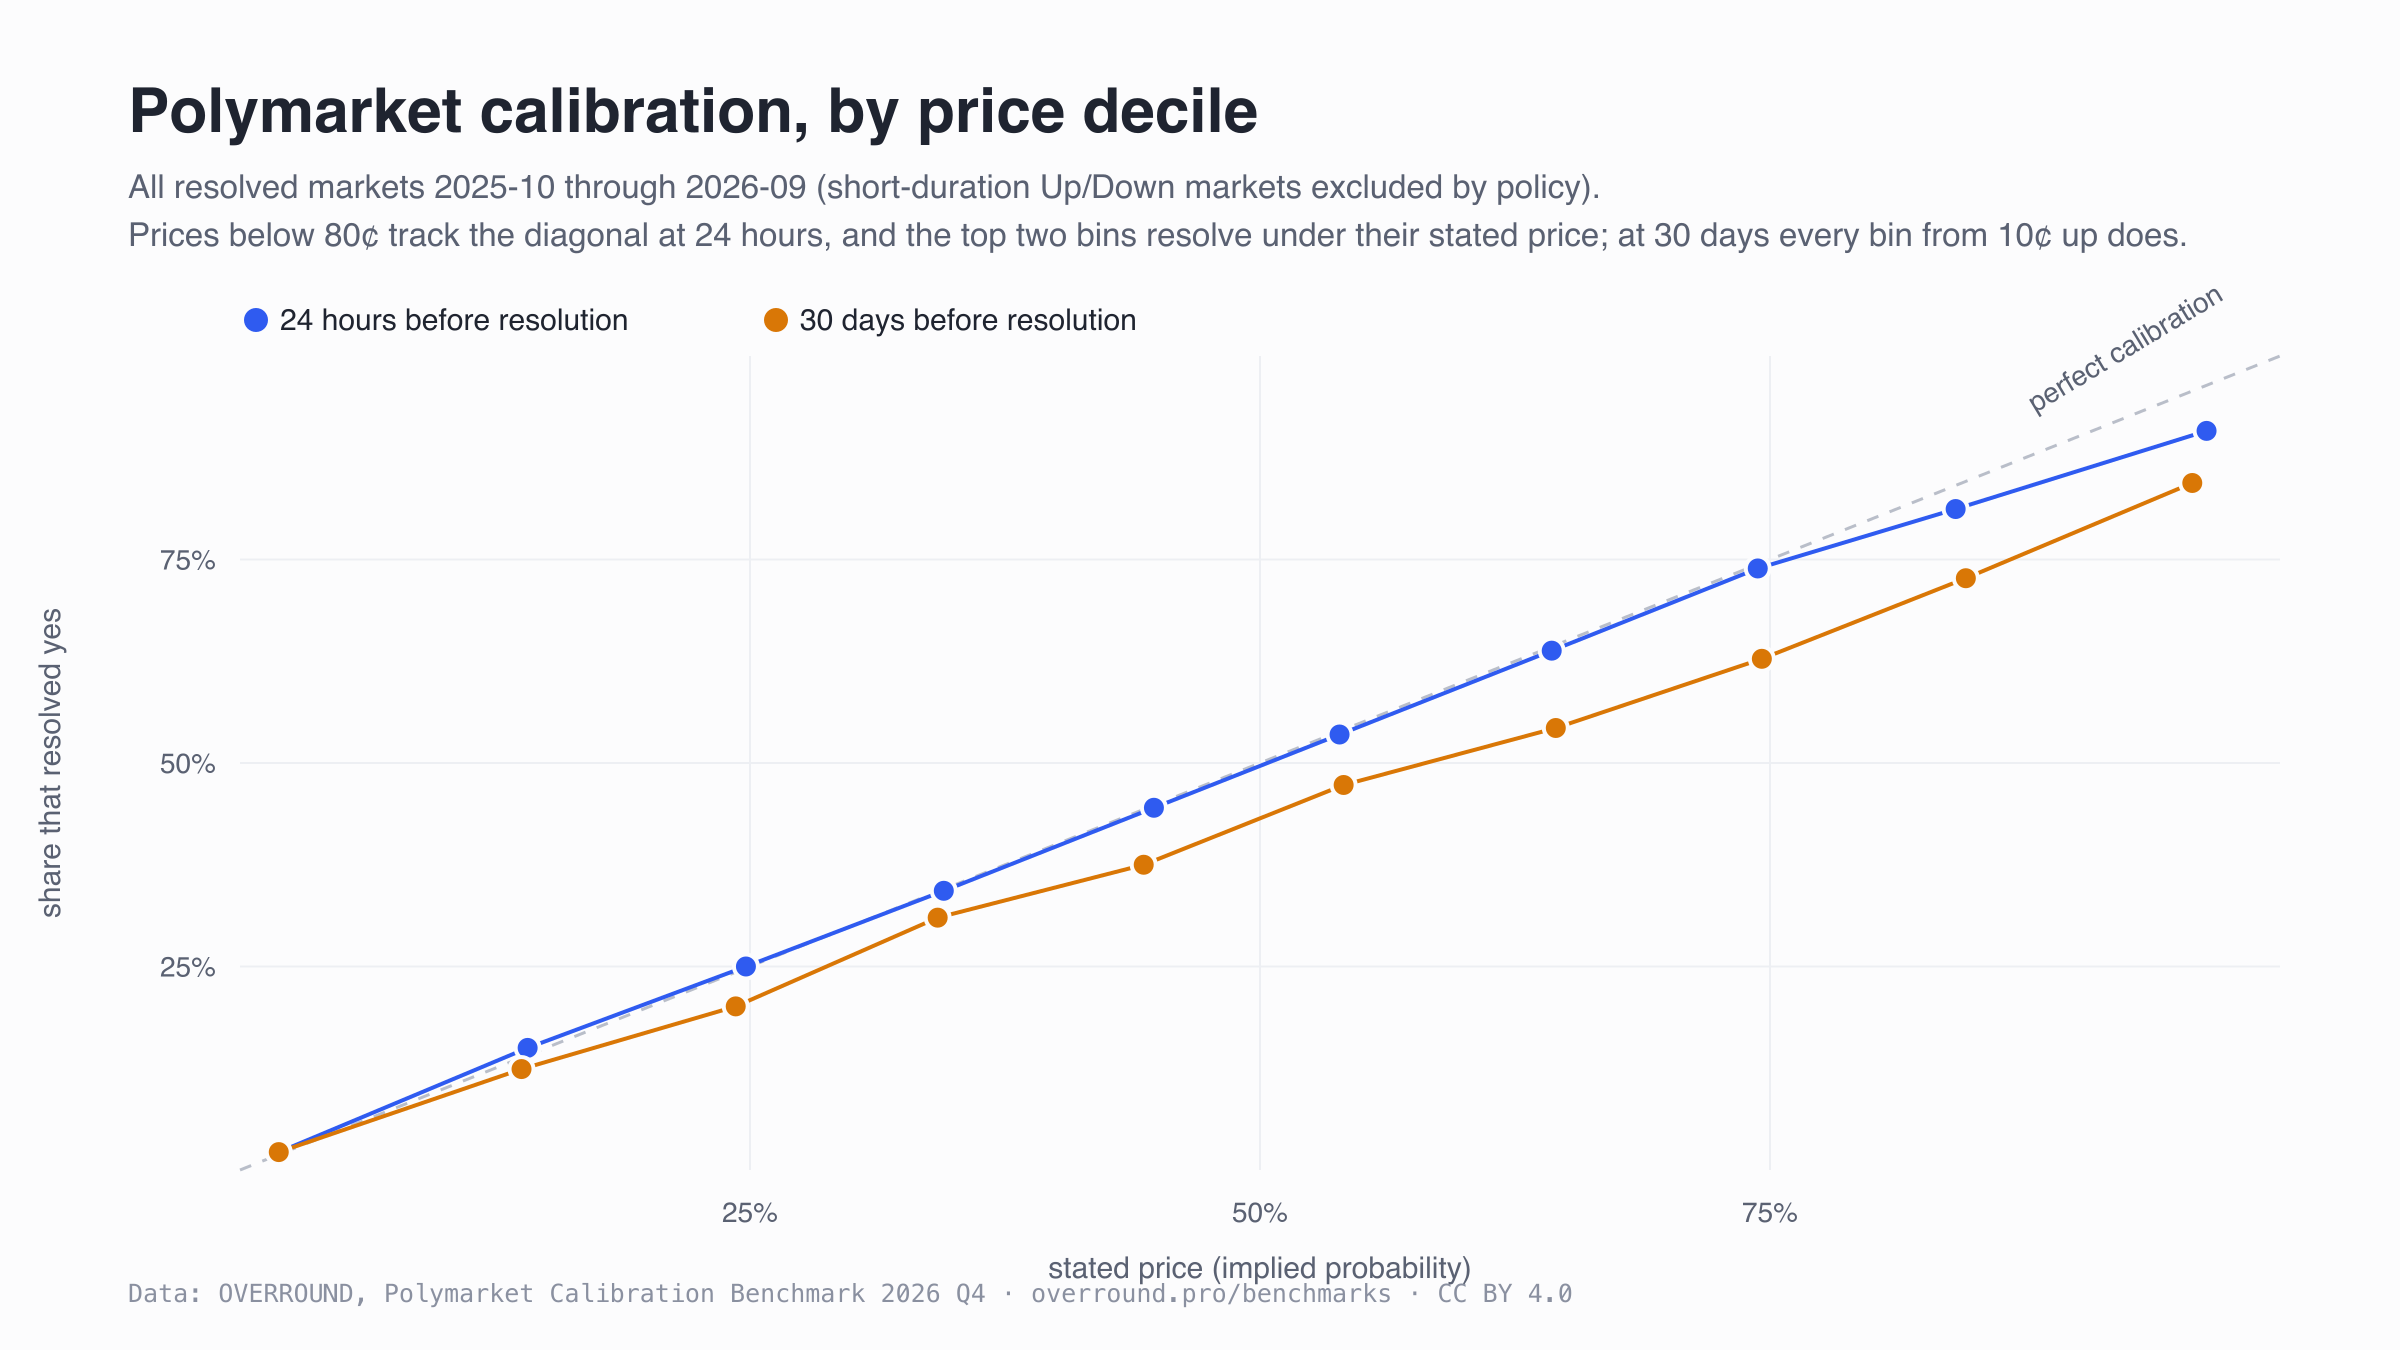
A calibrated market resolves 30-cent outcomes about 30% of the time. The curves at 24 hours and 30 days:
| price bin (24h) | markets | stated (avg) | resolved |
|---|---|---|---|
| 0-10c | 184,846 | 1.9% | 2.2% |
| 10-20c | 35,478 | 14.1% | 15.0% |
| 20-30c | 36,670 | 24.8% | 25.0% |
| 30-40c | 32,062 | 34.5% | 34.3% |
| 40-50c | 40,126 | 44.8% | 44.5% |
| 50-60c | 37,443 | 53.9% | 53.5% |
| 60-70c | 19,928 | 64.3% | 63.8% |
| 70-80c | 14,867 | 74.4% | 73.9% |
| 80-90c | 11,368 | 84.1% | 81.2% |
| 90-100c | 21,287 | 96.4% | 90.8% |
| price bin (30d) | markets | stated (avg) | resolved |
|---|---|---|---|
| 0-10c | 20,721 | 1.9% | 2.2% |
| 10-20c | 2,685 | 13.8% | 12.4% |
| 20-30c | 1,660 | 24.3% | 20.1% |
| 30-40c | 1,047 | 34.2% | 31.0% |
| 40-50c | 839 | 44.3% | 37.5% |
| 50-60c | 816 | 54.1% | 47.3% |
| 60-70c | 621 | 64.5% | 54.3% |
| 70-80c | 621 | 74.6% | 62.8% |
| 80-90c | 697 | 84.6% | 72.7% |
| 90-100c | 1,266 | 95.7% | 84.4% |
At 24 hours, every bin under 80 cents resolved within a point of its stated price (44.8-cent markets resolved 44.5% of the time). The two top bins resolved below theirs, 84.1-cent markets 81.2% of the time and 96.4-cent markets 90.8%. At 30 days every bin from 10 cents up resolved below its stated price, by 10 to 12 points from 60 cents up. Each market sits in these curves once, at the price of the outcome Polymarket lists first (Yes, in Yes/No markets). A market’s favorite is whichever outcome is priced above 50 cents. A month out, favorites as a whole resolved 90.2% of the time against 91.1% stated, 0.9 points under, and first-listed favorites resolved 10.4 points under (the favorites table below; gaps are computed before rounding). The robustness cuts below trace most of the first-listed gap to thin markets, as they did in the Q3 edition.
Accuracy by category, 24 hours out
| category | markets | stated (avg) | resolved | Brier | accuracy |
|---|---|---|---|---|---|
| Sports | 258,020 | 30.4% | 29.7% | 0.1427 | 78.5% |
| Politics | 30,726 | 20.3% | 21.1% | 0.0629 | 91.0% |
| Weather | 26,136 | 9.5% | 9.3% | 0.0507 | 93.0% |
| Esports | 25,137 | 42.6% | 42.4% | 0.1703 | 74.5% |
| Crypto | 24,662 | 10.2% | 10.9% | 0.0453 | 93.7% |
| Tennis | 20,100 | 47.7% | 48.0% | 0.2029 | 68.3% |
| Finance | 16,687 | 24.2% | 27.5% | 0.0830 | 88.6% |
| Movies | 4,984 | 22.1% | 21.3% | 0.0337 | 95.7% |
| Awards | 3,564 | 17.2% | 16.3% | 0.0686 | 91.2% |
| AI | 3,187 | 13.1% | 13.9% | 0.0194 | 97.4% |
| Music | 3,181 | 14.0% | 13.6% | 0.0232 | 97.0% |
| Culture | 3,017 | 19.0% | 17.8% | 0.0567 | 92.4% |
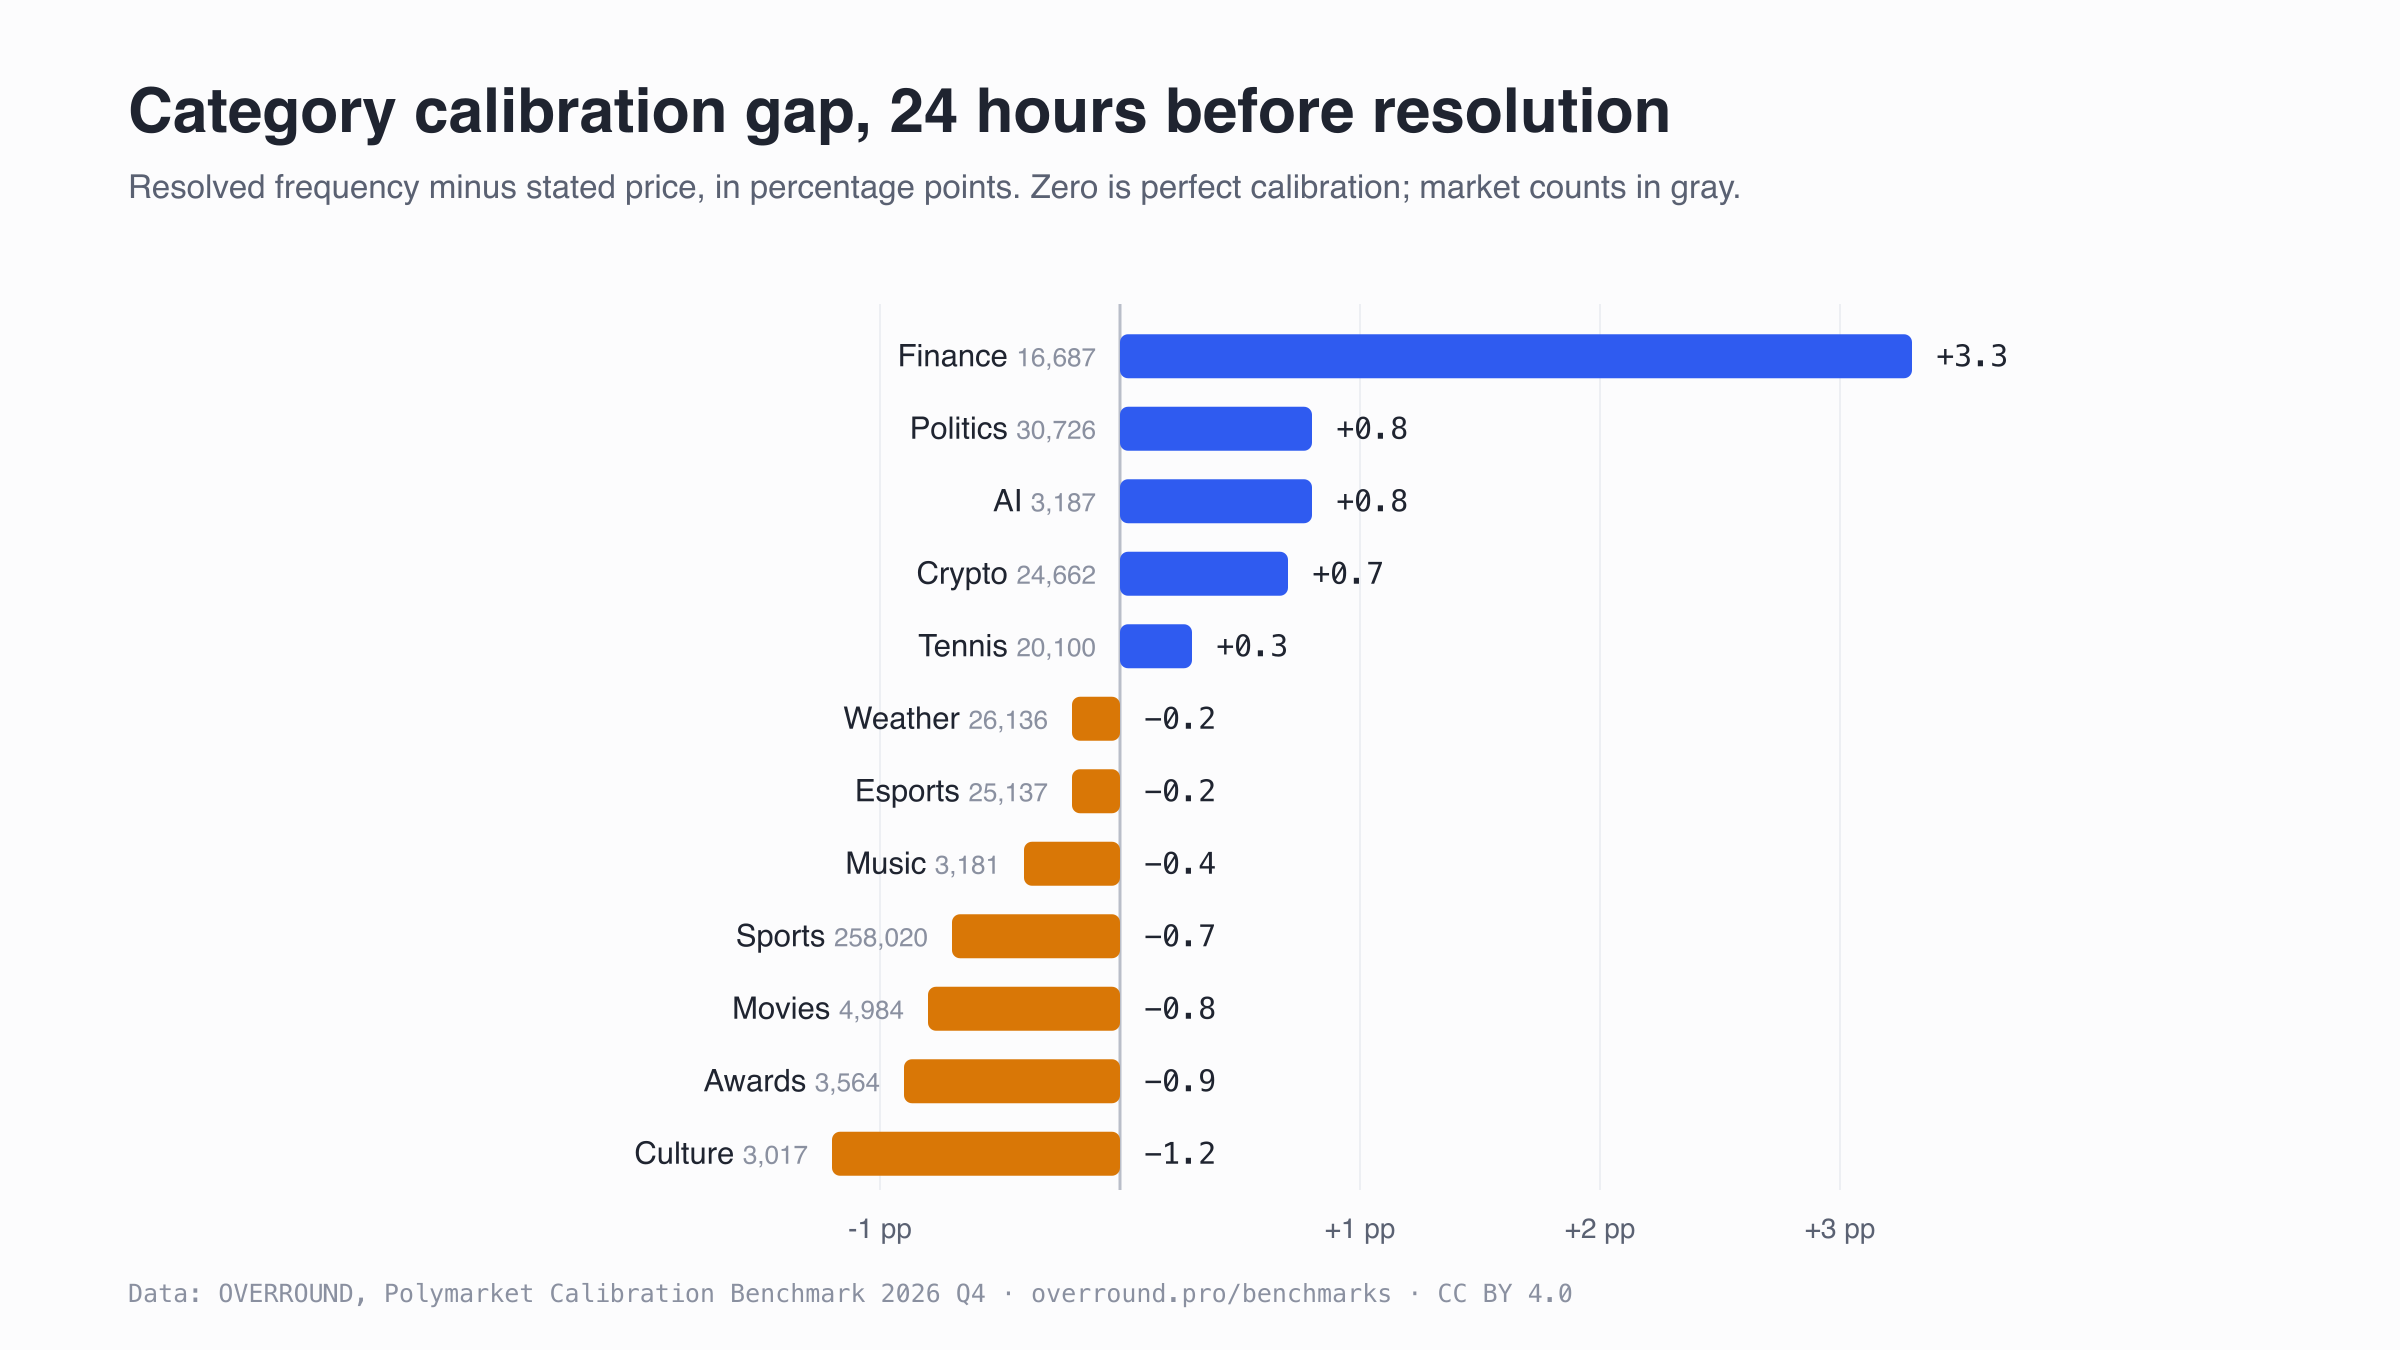
This edition rates every category with at least 2,000 markets at 24 hours, twelve in all; the Q3 edition rated eight. Finance again resolved furthest above its stated prices, by 3.3 points. Category Brier scores are not quality grades on their own. A category full of heavy favorites earns a low Brier by construction, and a category trading near 50 cents cannot, so the table carries the stated price beside each score.
Each category name links to that category’s board, which ranks the wallets trading the category against the prices they paid. The rows here measure the market; the board measures wallet records inside it, and a score there describes a record rather than a person.
How old the price is at the short horizons
The method takes the last traded price at or before each cutoff, so a market that stopped trading early carries an older price into the 1-hour and 24-hour rows. Polymarket’s listing data flags some game markets, including every tennis market in a July to September 2026 sample, to cancel resting orders when play starts, and some saw no trade between the start and the hour before resolution. For those markets, the price an hour before resolution is a pre-game price. The method is the one the Q3 edition used, so the two editions compare; these tables show how much of each short-horizon row rests on older prices.
| horizon | price traded before the cutoff by | markets | share | stated | resolved | Brier | accuracy |
|---|---|---|---|---|---|---|---|
| 1 hour | under 1 hour | 310,958 | 24.5% | 55.2% | 55.1% | 0.0458 | 93.6% |
| 1 hour | 1 to 6 hours | 778,707 | 61.3% | 32.2% | 30.7% | 0.0259 | 96.4% |
| 1 hour | 6 to 24 hours | 121,223 | 9.5% | 20.7% | 19.3% | 0.0604 | 91.2% |
| 1 hour | over 24 hours | 59,720 | 4.7% | 12.5% | 11.0% | 0.0427 | 94.2% |
| 24 hours | under 1 hour | 107,167 | 24.7% | 32.3% | 32.5% | 0.1369 | 78.9% |
| 24 hours | 1 to 6 hours | 132,451 | 30.5% | 29.9% | 29.7% | 0.1300 | 80.4% |
| 24 hours | 6 to 24 hours | 95,435 | 22.0% | 26.4% | 26.0% | 0.1137 | 83.4% |
| 24 hours | over 24 hours | 99,022 | 22.8% | 21.6% | 21.0% | 0.0992 | 86.2% |
At 1 hour, prices traded 6 to 24 hours before the cutoff were the least accurate band (91.2%). At 24 hours, accuracy rose with the price’s age, from 78.9% for prices under an hour old to 86.2% for prices over a day old, and older prices averaged lower (stated 21.6% against 32.3%).
On game markets (those whose listing carries a game start time), a 1-hour price counts as pre-game when it was traded before that start.
| resolution quarter | game markets | pre-game | pre-game share | accuracy, pre-game | accuracy, after start |
|---|---|---|---|---|---|
| 2025 Q4 | 56,117 | 2,501 | 4.5% | 72.5% | 98.6% |
| 2026 Q1 | 213,196 | 3,595 | 1.7% | 93.5% | 99.7% |
| 2026 Q2 | 283,598 | 32,516 | 11.5% | 84.6% | 97.8% |
| 2026 Q3 | 572,324 | 141,839 | 24.8% | 82.1% | 94.7% |
| category | game markets | pre-game | pre-game share | accuracy, pre-game | accuracy, after start |
|---|---|---|---|---|---|
| Sports | 728,752 | 141,759 | 19.5% | 85.4% | 96.7% |
| Esports | 202,280 | 6,838 | 3.4% | 75.1% | 99.1% |
| Tennis | 142,046 | 28,485 | 20.1% | 68.7% | 92.9% |
The pre-game share of 1-hour prices on game markets was under 5% from October 2025 to March 2026, 11.5% in April to June 2026 and 24.8% in July to September 2026. In that last quarter, favorites at pre-game prices won 82.1% of the time and favorites priced after the start 94.7%. Across the whole window, Tennis and Esports show the widest gaps (68.7% against 92.9%, and 75.1% against 99.1%).
What changed since the Q3 edition
- Window and mix. The window moved forward a quarter, and Polymarket listed far more markets in 2026. Nearly half of this edition’s 1-hour rows resolved in July through September 2026.
| resolution quarter | 1 hour | 24 hours | 7 days | 30 days |
|---|---|---|---|---|
| 2025 Q4 | 75,459 (5.9%) | 40,221 (9.3%) | 12,524 (12.7%) | 3,516 (11.4%) |
| 2026 Q1 | 246,634 (19.4%) | 82,606 (19.0%) | 24,911 (25.2%) | 7,127 (23.0%) |
| 2026 Q2 | 326,682 (25.7%) | 121,238 (27.9%) | 31,394 (31.8%) | 9,296 (30.0%) |
| 2026 Q3 | 621,833 (48.9%) | 190,010 (43.8%) | 29,833 (30.2%) | 11,034 (35.6%) |
- The shared months agree. For markets resolved from October 2025 through June 2026, this edition was rebuilt from the trade record and compared with the Q3 table. Every outcome matches. Markets in only one edition are at most 0.065% of any horizon, and prices differ only where several fills share the final second before a cutoff. This edition takes the earliest of those fills on-chain, where the Q3 edition kept storage order.
| horizon | in both | Q3 only | Q4 only | outcome differs | price differs |
|---|---|---|---|---|---|
| 1 hour | 648,660 | 89 | 115 | 0 | 1,335 |
| 24 hours | 244,019 | 53 | 46 | 0 | 272 |
| 7 days | 68,803 | 19 | 26 | 0 | 62 |
| 30 days | 19,936 | 6 | 3 | 0 | 24 |
- Categories. Polymarket re-tagged many markets in September and October 2026, and OVERROUND re-filed them, so the category counts here do not line up with the Q3 edition’s. Tennis now appears as its own category.
- Resolution times. On 2026-10-08 OVERROUND found that many markets resolved from July 2026, and most from August, kept Polymarket’s scheduled end time where the moment Polymarket closed the market belonged, which placed many game markets’ “resolution” at kickoff. They were repaired before this edition was computed, and the fact sheet now fails an edition when more than 5% of any quarter’s resolution times fall on a whole minute, the mark of a scheduled time. After the repair, 4.4% of the 2026 Q3 rows still do, against at most 1.7% in any quarter of the Q3 edition; some real close times also land on a whole minute. The Q3 edition’s window ends before the problem started.
Robustness cuts on the 30-day gap
The Q3 edition traced its 30-day gap on first-listed outcomes priced 50 cents or more to thin, stale markets, and these are the same cuts on this edition. The gap again concentrates in thin markets and shrinks to 1.8 points in the most liquid tercile, and weighted by dollar volume, three of the five bins from 50 cents up resolved above their stated prices. These cuts cover the 30,973 markets with a traded price 30 days before resolution. Liquidity is dollar volume in the 30 days before that price; staleness is the age of the last trade behind it. Each cut states its own sample size, and cross-tab cells under 50 markets are indicative only. Intervals are 95% Wilson.
The first table splits each market’s favorite by whether Polymarket lists it first. A second-listed favorite’s price is 1 minus the first-listed price. First-listed favorites resolved 10.4 points under their prices a month out. Second-listed favorites priced 50 to 90 cents resolved 3.5 points above theirs, and those from 90 cents up resolved 0.3 points under. Favorites as a whole resolved 0.9 points under. Gaps are computed before rounding. The cuts after this table take the markets whose first-listed outcome was priced 50 cents or more, which are the first-listed favorites plus 127 markets at exactly 50 cents. Until 2026-10-09 this page called those cuts favorites (see the correction log).
| favorite, 30d | price band | markets | stated | resolved | gap (pp) | 95% CI |
|---|---|---|---|---|---|---|
| first-listed | 50-90c | 2,628 | 69.7% | 59.7% | -10.0 | 57.8-61.6% |
| first-listed | 90-100c | 1,266 | 95.7% | 84.4% | -11.4 | 82.3-86.3% |
| first-listed | all | 3,894 | 78.1% | 67.7% | -10.4 | 66.2-69.2% |
| second-listed | 50-90c | 5,824 | 74.9% | 78.3% | +3.5 | 77.3-79.4% |
| second-listed | 90-100c | 21,128 | 97.9% | 97.6% | -0.3 | 97.4-97.8% |
| second-listed | all | 26,952 | 92.9% | 93.4% | +0.5 | 93.1-93.7% |
| all favorites | all | 30,846 | 91.1% | 90.2% | -0.9 | 89.8-90.5% |
| liquidity tercile (first-listed ≥50c) | markets | stated | resolved | gap (pp) | 95% CI |
|---|---|---|---|---|---|
| bottom (under $168) | 1,124 | 77.6% | 51.2% | -26.4 | 48.2-54.1% |
| middle ($168-$2,342) | 1,144 | 76.3% | 68.4% | -7.8 | 65.7-71.1% |
| top (over $2,342) | 1,753 | 77.7% | 75.9% | -1.8 | 73.8-77.8% |
| last trade behind the 30d price (first-listed ≥50c) | markets | stated | resolved | gap (pp) | 95% CI |
|---|---|---|---|---|---|
| within 7 days | 3,345 | 76.9% | 67.7% | -9.2 | 66.1-69.2% |
| older than 7 days | 676 | 79.3% | 62.7% | -16.5 | 59.0-66.3% |
| bin (30d) | markets | stated, market-weighted | resolved, market-weighted | stated, volume-weighted | resolved, volume-weighted |
|---|---|---|---|---|---|
| 0-10c | 20,721 | 1.9% | 2.2% | 1.6% | 0.3% |
| 10-20c | 2,685 | 13.8% | 12.4% | 13.7% | 17.3% |
| 20-30c | 1,660 | 24.3% | 20.1% | 24.0% | 26.2% |
| 30-40c | 1,047 | 34.2% | 31.0% | 33.6% | 37.9% |
| 40-50c | 839 | 44.3% | 37.5% | 45.0% | 69.5% |
| 50-60c | 816 | 54.1% | 47.3% | 55.6% | 53.2% |
| 60-70c | 621 | 64.5% | 54.3% | 66.6% | 74.9% |
| 70-80c | 621 | 74.6% | 62.8% | 73.2% | 69.5% |
| 80-90c | 697 | 84.6% | 72.7% | 85.0% | 93.7% |
| 90-100c | 1,266 | 95.7% | 84.4% | 95.9% | 99.4% |
Volume weights are dominated by the largest markets, so the volume-weighted columns say where the dollars traded rather than what a typical market did. Counted per market, first-listed outcomes from 10 cents up resolved below their prices a month out; weighted by money, the 90-100 cent bin resolved 99.4% of the time against a 95.9% stated price.
| category (30d, first-listed ≥50c) | markets | stated | resolved | gap (pp) | 95% CI |
|---|---|---|---|---|---|
| Sports | 1,204 | 75.9% | 63.9% | -12.1 | 61.1-66.5% |
| Politics | 1,097 | 78.5% | 71.1% | -7.4 | 68.4-73.7% |
| Finance | 258 | 75.8% | 39.1% | -36.7 | 33.4-45.2% |
| Crypto | 219 | 78.5% | 71.2% | -7.3 | 64.9-76.8% |
| Awards | 196 | 76.4% | 72.4% | -4.0 | 65.8-78.2% |
| Esports | 137 | 83.0% | 67.9% | -15.1 | 59.7-75.1% |
| AI | 136 | 76.8% | 77.2% | +0.4 | 69.5-83.5% |
| Music | 116 | 83.2% | 81.9% | -1.3 | 73.9-87.8% |
In Sports, Politics, Finance, Crypto and Esports, first-listed outcomes at 50 cents or more resolved below their stated prices beyond their 95% intervals; Awards, AI and Music stayed within theirs.
| category | liquidity tercile | markets | stated | resolved | gap (pp) | 95% CI |
|---|---|---|---|---|---|---|
| Sports | 1 (thin) | 524 | 77.1% | 54.6% | -22.6 | 50.3-58.8% |
| Sports | 2 | 375 | 74.4% | 69.1% | -5.3 | 64.2-73.5% |
| Sports | 3 (liquid) | 305 | 75.8% | 73.4% | -2.3 | 68.2-78.1% |
| Politics | 1 (thin) | 183 | 76.1% | 47.5% | -28.5 | 40.4-54.8% |
| Politics | 2 | 346 | 79.8% | 70.8% | -9.0 | 65.8-75.4% |
| Politics | 3 (liquid) | 568 | 78.5% | 78.9% | +0.4 | 75.3-82.0% |
| Finance | 1 (thin) | 110 | 76.7% | 25.5% | -51.2 | 18.2-34.3% |
| Finance | 2 | 70 | 70.9% | 27.1% | -43.7 | 18.1-38.5% |
| Finance | 3 (liquid) | 78 | 79.0% | 69.2% | -9.8 | 58.3-78.4% |
| Crypto | 1 (thin) | 38 * | 81.7% | 60.5% | -21.2 | 44.7-74.4% |
| Crypto | 2 | 58 | 77.8% | 86.2% | +8.4 | 75.1-92.8% |
| Crypto | 3 (liquid) | 123 | 77.8% | 67.5% | -10.4 | 58.8-75.1% |
| Awards | 1 (thin) | 40 * | 75.0% | 47.5% | -27.5 | 32.9-62.5% |
| Awards | 2 | 36 * | 78.2% | 91.7% | +13.4 | 78.2-97.1% |
| Awards | 3 (liquid) | 120 | 76.3% | 75.0% | -1.3 | 66.6-81.9% |
In each of the five cross-tab categories, the thin tercile resolved 20 or more points below its stated price (cells marked * hold fewer than 50 markets and are indicative only), while liquid politics markets in this cut resolved 0.4 points above their prices. Finance resolved below its stated price in all three terciles, as it did in the Q3 edition. The politics table below is a 24-hour cut of all 30,726 politics markets, separate from the 30-day cuts.
| Politics, 24h, by decile | markets | stated | resolved | 95% CI |
|---|---|---|---|---|
| 0-10c | 20,256 | 1.0% | 1.1% | 0.9-1.2% |
| 10-20c | 1,480 | 14.2% | 18.8% | 16.9-20.9% |
| 20-30c | 1,107 | 24.3% | 29.5% | 26.9-32.3% |
| 30-40c | 1,004 | 34.6% | 40.2% | 37.2-43.3% |
| 40-50c | 907 | 44.3% | 47.6% | 44.4-50.9% |
| 50-60c | 948 | 54.2% | 56.1% | 52.9-59.2% |
| 60-70c | 827 | 64.7% | 68.1% | 64.8-71.2% |
| 70-80c | 894 | 74.4% | 74.3% | 71.3-77.0% |
| 80-90c | 908 | 84.6% | 83.4% | 80.8-85.7% |
| 90-100c | 2,395 | 96.9% | 96.2% | 95.4-96.9% |
A day out, first-listed politics outcomes priced from 10 to 70 cents happened more often than their prices stated (14-cent markets resolved 18.8% of the time), while those priced from 70 cents up resolved at or slightly below theirs.
The public accuracy figures
The Q3 edition sets its tables beside the published figures, Polymarket’s own accuracy page, a Dune analysis of Polymarket’s Brier score, a Vanderbilt study of political markets and a 2026 study across Kalshi and Polymarket, with links and the dates they were read. Those comparisons were not redone for this edition.
Reuse these charts
Every chart on this page is CC BY 4.0. Download, republish, or embed it, including commercially, with attribution. Suggested credit: Data: OVERROUND, Polymarket Calibration Benchmark 2026 Q4, overround.pro/benchmarks (CC BY 4.0). PNGs: calibration curves, horizon decay, category gap. The underlying tables are CSVs on the data downloads page.
Method and boundaries
- Universe: every Polymarket market that resolved between 2025-10-01 and 2026-09-30, excluding voided and disputed markets. One row per market per horizon: the last traded price of the first-listed outcome at that distance before resolution, against the realized outcome. Each market counts once per horizon and is scored on its last traded price at that distance from resolution. This measures Polymarket prices, not any trader, and markets with no trade at a horizon are absent from that horizon’s row.
- Counting: unlike OVERROUND’s wallet grading, sets of mutually exclusive outcomes are not collapsed into one event here, so a multi-outcome question counts each market separately. This matches how public accuracy dashboards count.
- Selection at long horizons: a market with no trade 30 days before resolution, including every market created inside that window, is absent from the 30-day row. Long-horizon rows therefore describe markets that existed and traded early. The headline table removes this confound by scoring only the 30,973 markets priced at all four horizons.
- Ties: where several fills share the final second before a cutoff, the price is the earliest of those fills on-chain.
- Coverage: Polymarket’s five-minute Up or Down series are excluded by standing policy. Fill observation for NegRisk V2 contracts had a gap from late April 2026 that was repaired and backfilled on 2026-07-20, and resolution times were repaired on 2026-10-08 (above); the fact sheet checks both on every run. Full boundaries on the methodology page.
Citing this page
- Cite as OVERROUND (overround.pro), Polymarket calibration benchmark, 2026 Q4. The date pins the snapshot; the next edition ships next quarter.
- For academic citation, this edition has a DOI: 10.5281/zenodo.23263367. It resolves to a Zenodo archive of the same CSVs and charts, deposited as a fixed edition, so the citation keeps working independently of this site.
- License: CC BY 4.0. The core tables are downloadable as CSV from the data page; the robustness and price-age tables are published on this page only.
- Related: every edition on the benchmarks page, aggregate top-wallet calibration on the statistics page, wallet-level grading on the free checker, and the scoring method on the methodology page.
- Questions or data requests: hello@overround.pro.
Computed from public on-chain data by the same pipeline that serves the product, cross-checked before publication (including resolved-outcome spot checks against Polymarket’s public API). Nothing here is financial or investment advice. Past accuracy does not predict future outcomes.
The Weekly Skill Report. Each Monday, one free email counts the positions the alert feed first flagged last week and how many have since won or lost. It names the busiest categories and the ledger’s running total, and links to every graded row.
Free. Unsubscribe anytime. Privacy.